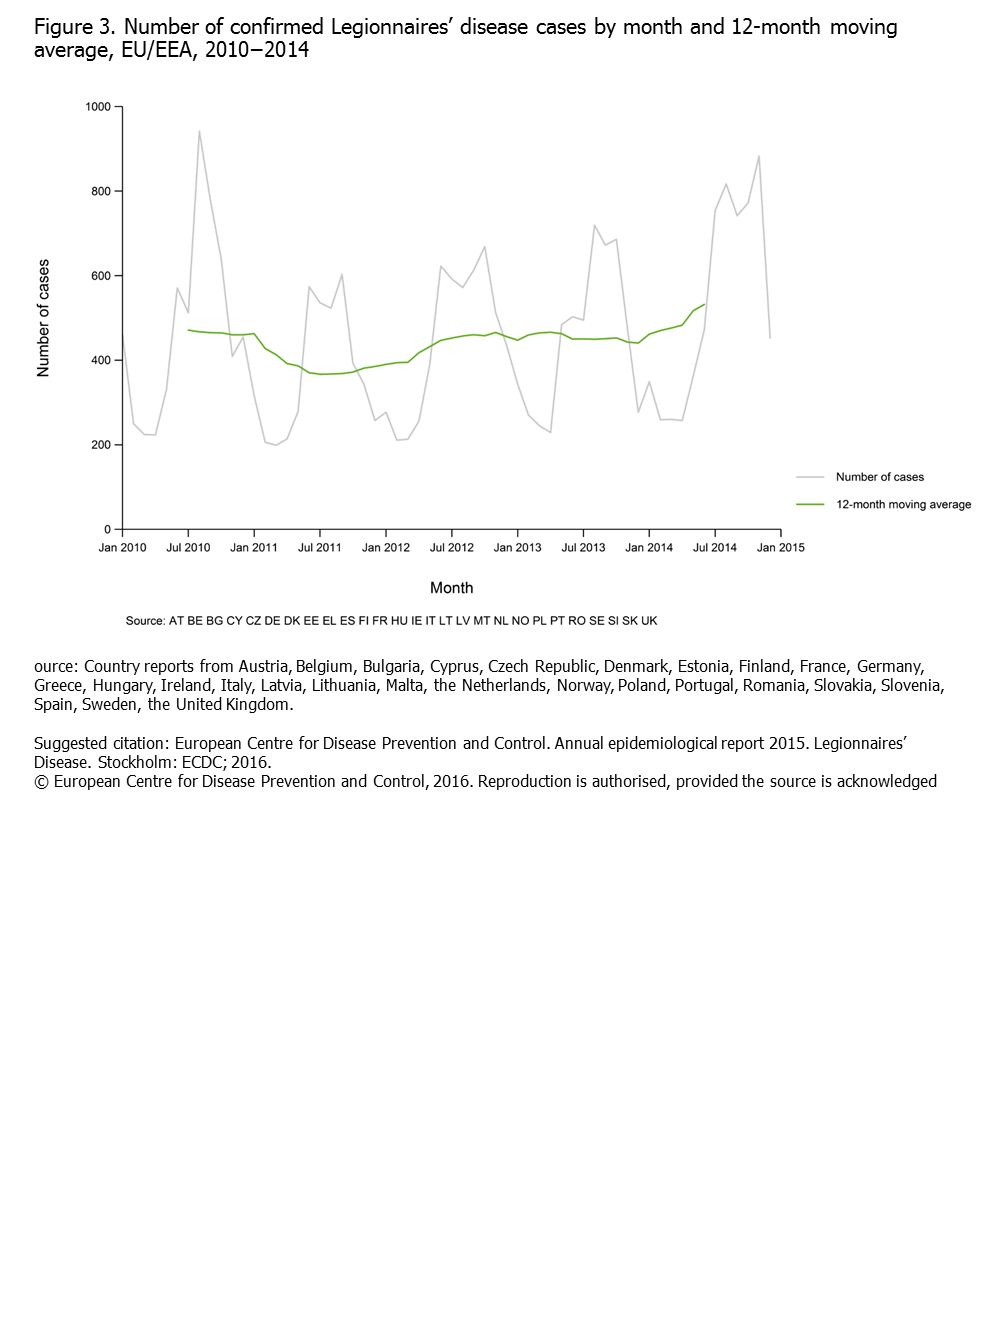
Figure 3. Number of confirmed Legionnaires’ disease cases by month and 12-month moving average, EU/EEA, 2010−2014
Number of confirmed Legionnaires’ disease cases by month and 12-month moving average, EU/EEA, 2010−2014
Download

LD-Slide4.PNG - EN - [PNG-120.85 KB]