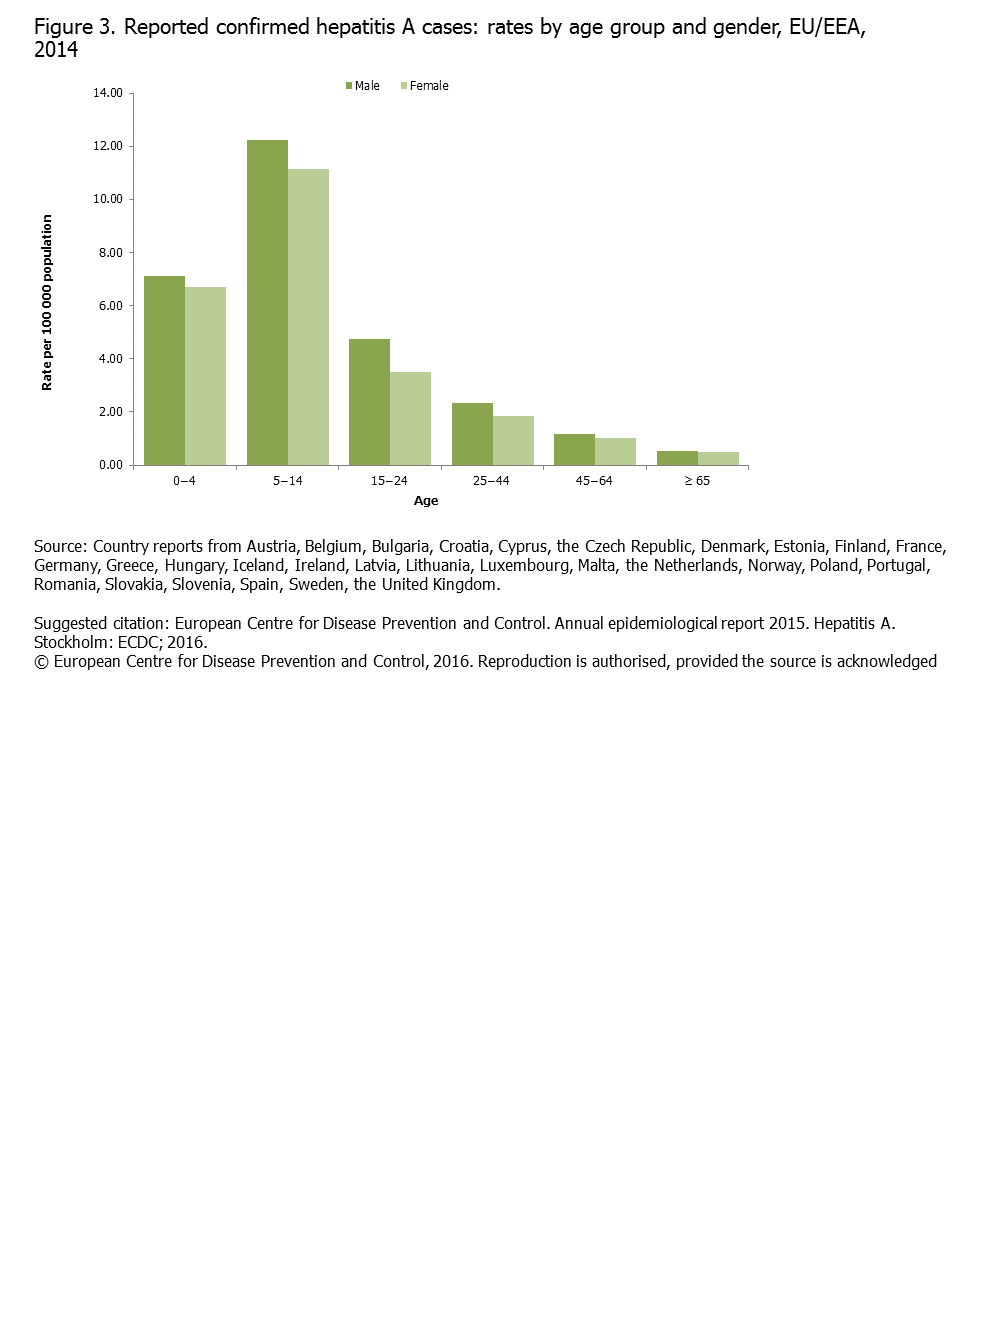
Figure 3. Reported confirmed hepatitis A cases: rates by age group and gender, EU/EEA, 2014
Reported confirmed hepatitis A cases: rates by age group and gender, EU/EEA, 2014
Download

Slide3.PNG - EN - [PNG-30.36 KB]
Reported confirmed hepatitis A cases: rates by age group and gender, EU/EEA, 2014