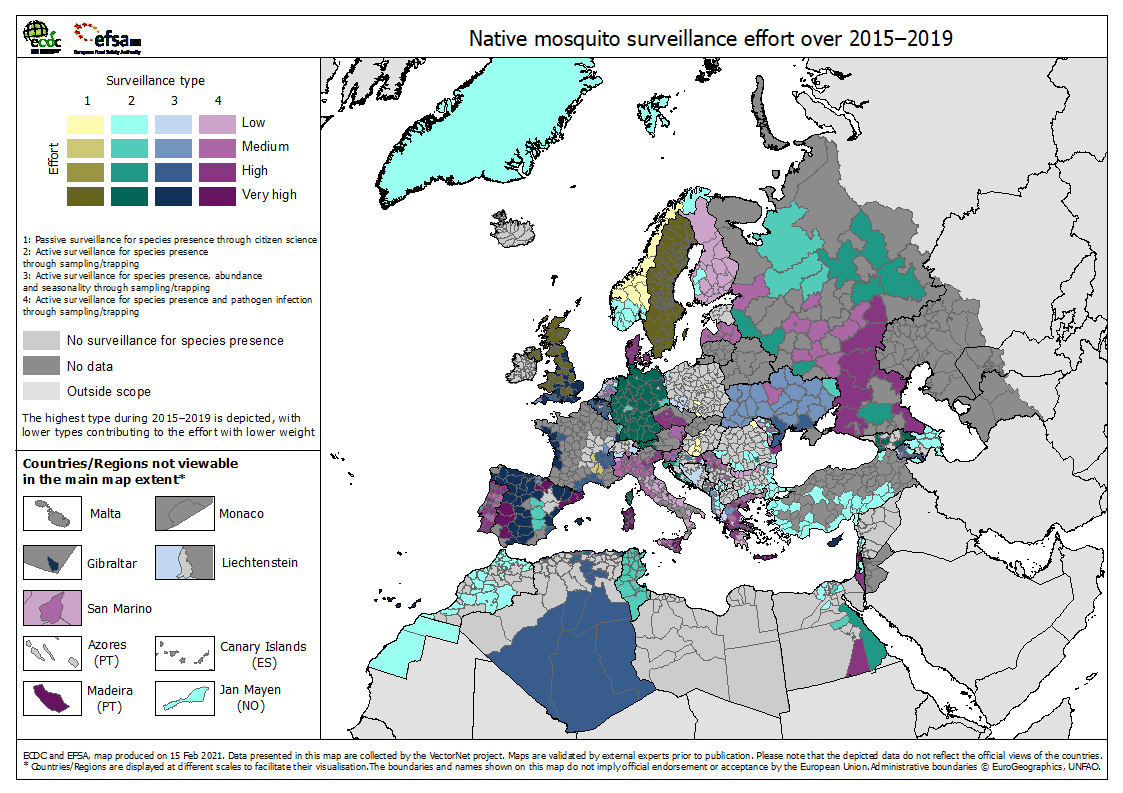
Native mosquito surveillance effort over 2015–2019
The map 'Invasive mosquito surveillance effort over 2015–2019' shows the surveillance effort per administrative area, by highest surveillance type.
Download

The surveillance categories are:
1 = passive surveillance for species presence through citizen science
2 = active surveillance for species presence through sampling/trapping (with or without passive surveillance)
3 = active surveillance for species presence, abundance and seasonality through sampling/trapping (with or without passive surveillance)
4 = active surveillance for species presence and pathogen infection through sampling/trapping (with or without passive surveillance)
The highest surveillance type that occurred in an administrative area during 2015–2019 is depicted, with lower type categories contributing to the effort score with a lower weight. Weights were as follows:
Table: Weights for native mosquito surveillance effort
|
|
Highest level |
|||
|
Level |
1 |
2 |
3 |
4 |
|
1 |
1 |
0 |
0 |
0 |
|
2 |
|
1 |
0.5 |
0.25 |
|
3 |
|
|
1 |
0.5 |
|
4 |
|
|
|
1 |
The data (occurrence of any surveillance activity type during the time period in the administrative unit) was collected by year over 2015 and 2016, and by month over 2017, 2018 and 2019 (The years 2015 and 2016 each carrying 1/12th of the weight of the later years). The score was summed and divided by the maximum score (38) and distributed over the four Effort classes (Low, Medium, High and Very high) according to equal intervals.
Native mosquito surveillance techniques are very diverse; and include: (1) presence data only, mainly based on citizen science projects; and (2) abundance and seasonality data acquired in areas where pest species occur and are controlled (e.g. parts of France) or more widely for scientific purposes. These abundance and seasonality data are associated with pathogen screening, both in areas where disease outbreaks are more frequent (West Nile infections in particular) and in currently disease free countries.
The surveillance coverage appears to be quite patchy in some countries, possibly because mosquito control activities and their associated surveillance are often implemented over relatively small areas. The current datasets suggest that there are surveillance data gaps in some countries. There are also gaps in surveillance data (as there are for native mosquito distribution data) for many countries. Finally, the current data suggests there is a need for strengthening the intensity of surveillance efforts in areas were mosquito borne pathogens are known to circulate, or be at risk of circulating.
Suggested citation: European Centre for Disease Prevention and Control and European Food Safety Authority. Mosquito maps [internet]. Stockholm: ECDC; 2021. Available from: https://ecdc.europa.eu/en/disease-vectors/surveillance-and-disease-data…