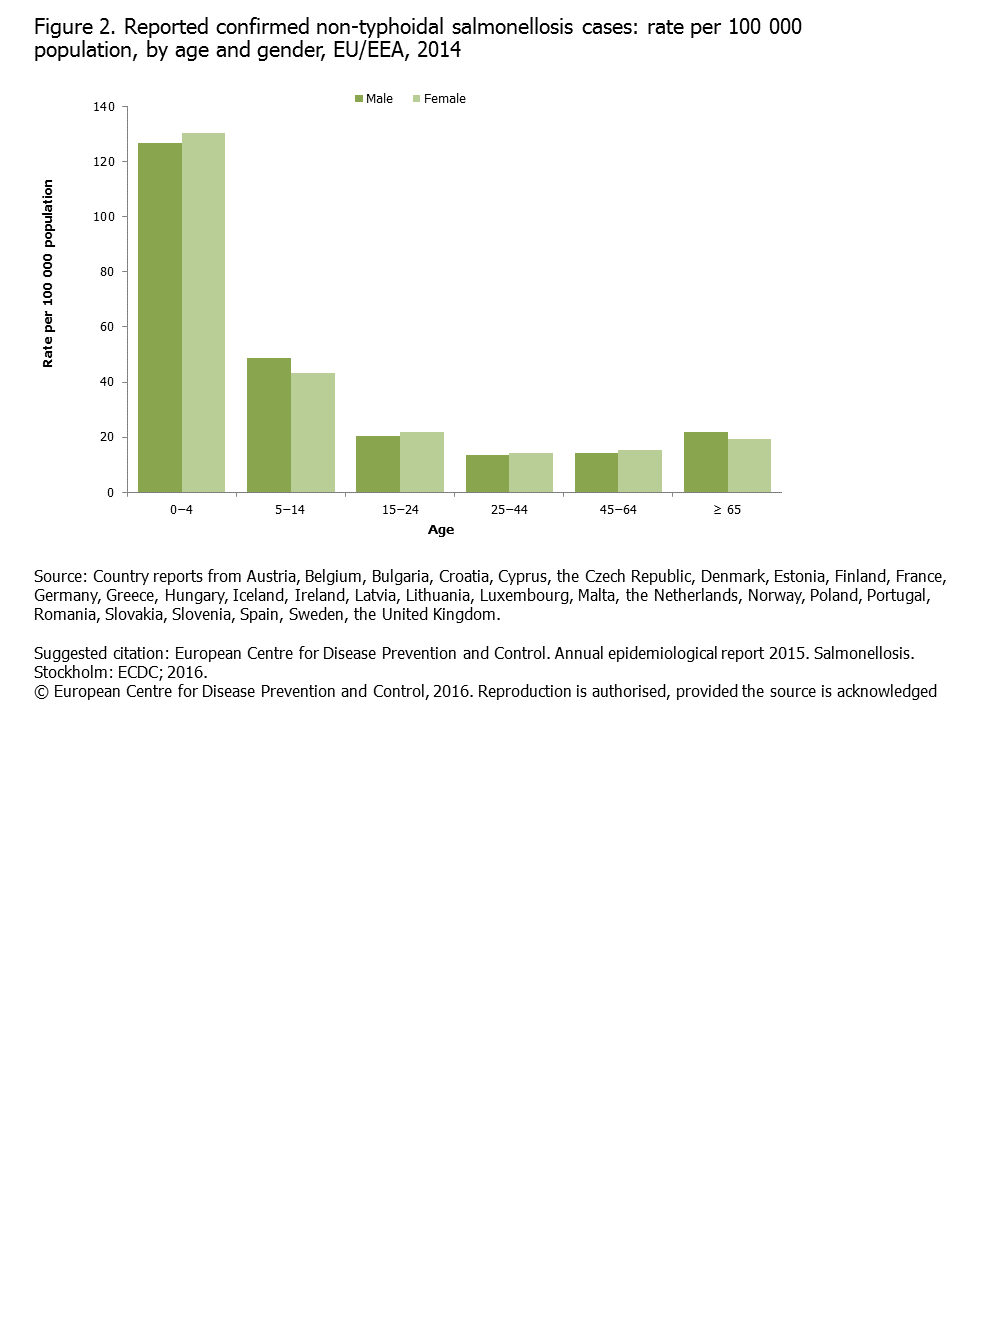
Figure 2. Reported confirmed non-typhoidal salmonellosis cases: rate per 100 000 population, by age and gender, EU/EEA, 2014
Reported confirmed non-typhoidal salmonellosis cases: rate per 100 000 population, by age and gender, EU/EEA, 2014
Download

Slide2.PNG - EN - [PNG-31.85 KB]