Infographic: Influenza in Europe, Season 2017-2018
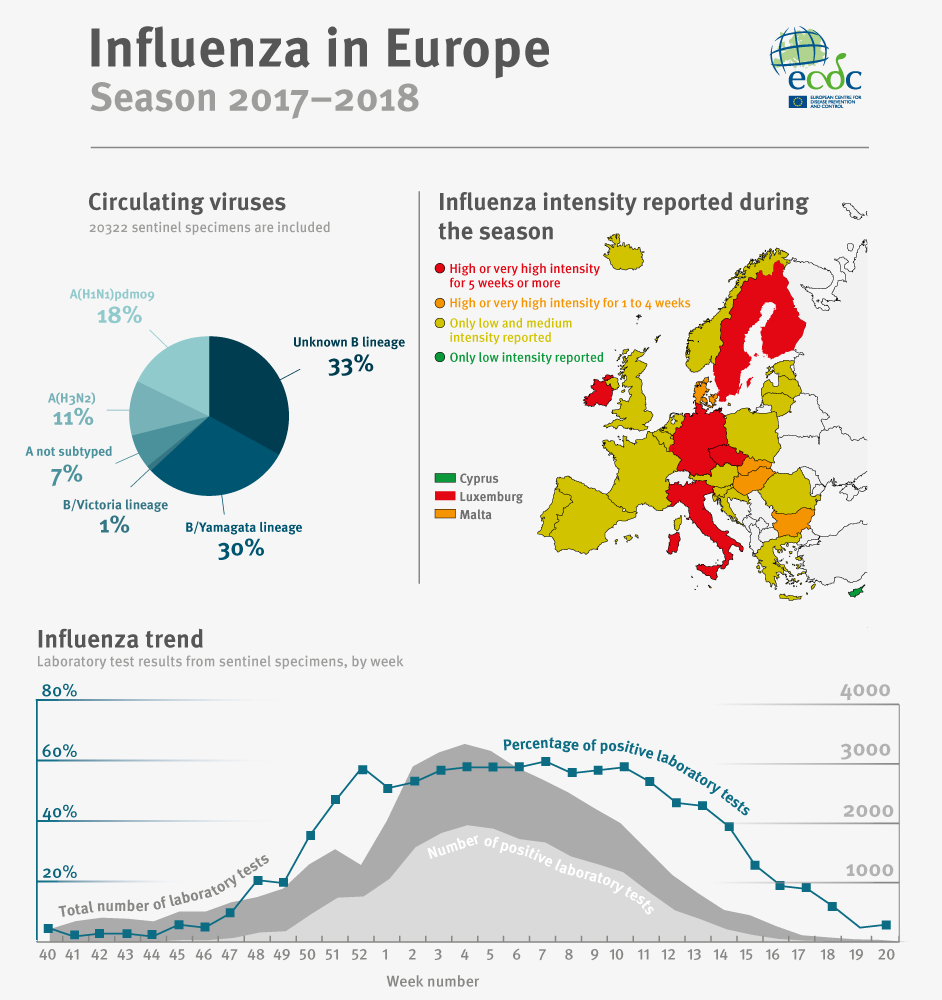
This infographic summarises the influenza season 2017-2018.

Download

Summary
Influenza activity started in week 47/2017 and returned to baseline levels in week 18/2018.
In northern and south-western Europe (EU/EEA) , the activity started to increase between mid-December and early January, similar to the timing of the 2016–2017 season but earlier than in the previous five seasons.
The peak in activity was in early January in south-western Europe and in mid-February 2018 in northern Europe (EU/EEA). In some countries in Eastern Europe, influenza activity did not peak until mid- to late March.
The majority of influenza viruses detected were of type B, representing a higher level of circulation of influenza B viruses compared to recent seasons. Of all subtyped influenza B viruses detected in sentinel samples, 97% were B/Yamagata and 3% were B/Victoria viruses. Both influenza A subtypes, A(H3N2) and A(H1N1)pdm09 co-circulated in the region. Of all subtyped A viruses detected in sentinel samples, 38% were A(H3N2) viruses and 62% were A(H1N1)pdm09 viruses.
Influenza viruses circulated at high levels between weeks 51/2017 and 13/2018. This is longer than in recent seasons and may have contributed to the high severity of the 2017/18 season. Especially influenza B activity was detected for a longer period of the season and at a greater magnitude than in the previous seasons. Severe cases were observed in hospital settings due to B virus, but also due to A(H3N2) and A(H1N1)pdm09 viruses. Overall, the majority of severe cases were due to influenza virus type B infection and mostly were persons 40 years of age or older. Patients in intensive care units were mostly infected by influenza type A virus.
Read more on the ECDC website
Seasonal influenza - Annual Epidemiological Report for 2017 - 2018
During the 2017–2018 season, 41 315 specimens from sentinel primary care providers were tested for influenza, 22% more than in the previous season; 49% of the specimens were positive for influenza virus (previous season: 40%).


